Predicting Benthic Impacts and Recovery after Fishing


A tool to assess the benthic impacts caused by a fishery, a predicted recovery trajectory and produce an indicative MSC score (please see the User Manual for information on the scoring issue(s) that the indicative score should inform).


Jennifer L. Shepperson, Lowri E. Evans, Jan G. Hiddink
Bangor University, October 2021


Read the information on the left hand side, then start with Task 1 and proceed through all 15 Tasks to complete the assessment.


TASK 1 / 15 - Is the data folder ready?

All data to be used within the tool is required to exist within a single folder on the user's computer. Please see the User Manual for further details.


TASK 2 / 15 - Start the assessment


We would like to know what type of users are using this tool, please choose from the dropdown list:


Disclaimer

This work is provided on a strictly as-is basis only, and no part of this work may be reproduced, stored or transmitted, in any form or by any means including photocopying and recording, except as expressly permitted under the aforementioned terms. This work is licensed under this Creative Commons BY-NC-ND . By using this app we assume you have read these Terms & Conditions.


By clicking the below button to start the tool, you agree to the above disclaimer.


Tool References

Below is a list of the main scientific peer-reviewed literature this tool is based on:

Hiddink et al (2019) Assessing bottom-trawling impacts based on the longevity of benthic invertebrates. Journal of Applied Ecology, 56(5), 1075-1084. Open access article: https://doi.org/10.1111/1365-2664.13278

Hiddink et al (2017) Global analysis of depletion and recovery of seabed biota following bottom trawling disturbance. Proceedings of the National Academy of Sciences, 114, 8301-8306. Open access article: https://doi.org/10.1073/pnas.1618858114

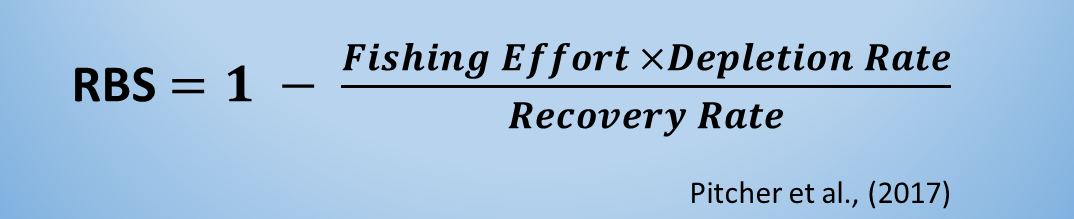
Pitcher et al (2017) Estimating the sustainability of towed fishing-gear impacts on seabed habitats: a simple quantitative risk assessment method applicable to data-limited fisheries. Methods in Ecology and Evolution, 8, 472-480. Open access article: https://doi.org/10.1111/2041-210X.12705

Pitcher et al (In prep) Trawl impacts and seabed habitat status in 24 regions of the world.

Rijnsdorp et al (2018) Estimating the sensitivity seafloor habitats to disturbance by bottom trawling impacts based on the longevity of benthic fauna. Ecological Applications, 28, 1302-1312. Open access article: https://doi.org/10.1002/eap.1731

Sciberras et al (2018) Response of benthic fauna to experimental bottom fishing: a global meta-analysis. Fish and Fisheries, 19, 698-715. Open access article: https://doi.org/10.1111/faf.12283


If you run into any trouble with accessing the above articles then please contact the MSC. Contact details are available in the User Manual.


Fishing Effort Data


Please return to Tab 1 and input user and usage types

On this tab you will input your fishing effort data. The fishing effort data needs to be a .csv file, with fishing effort recorded as area swept in km^2, with the aggregation of the data known. Full details about data formatting can be found in the User Manual (MSC Benthic Impacts Decision Support Tool User Manual). This .csv file should only contain points that represent fishing activity (i.e. no steaming activity). It must contain the following column headings, formatted in exactly the same way (i.e. use of capitals with no spaces etc):

Longitude - The longitude of the data point in decimal degrees

Latitude - The latitude of the data point in decimal degrees

Gear - The fishing gear type e.g. TBB, OT, DRB, SEINE etc

AreaSwept - The area swept by that fishing point (i.e. speed x gear width x duration in km^2)


Habitat Data


On this tab you will input 2 spatial datasets: an assessment area shapefile, and a habitat data shapefile. Habitat data is a required input for the tool, because impacts are assessed and scored per habitat type. You also need to upload a shapefile that delineates the extent of the area under assessment (this should cover the largest extent of the habitat under consideration, but no additional irrelevant areas (e.g. no areas of land)). Please see the User Manual for further information


This may take a few minutes to load (please be patient if you are assessing a large area). Click on the button to load the files in - you must select all files that make up the shapefile. When the data has loaded in, a map will appear on the right hand side of the window.


Swept Area Ratio


Fishing effort frequency is defined as the swept area ratio, which is the area swept by the fishing gear within a grid cell per year divided by the area of the grid cell i.e. year-1

Please see the User Manual for further detail.


Depletion Values


On this tab you will set the depletion rates to be used in the assessment. The rate of depletion is the fraction of benthic biota that is removed per trawl pass, which can be estimated from the penetration depth of the gear. Default depletion rates for the main trawl gear types are available in the tool. The depletion rate can depend on the sediment type as well as the gear type, so the tool can calculate improved estimations of default depletion rates if information about the habitat types input can be categorised as mud, sand or gravel. Alternatively, instead of using a default gear depletion rate, a user can input a more gear-specific depletion rate or penetration depth, but sufficient justification must be provided in the report for this. For further information and instruction about depletion rates see the User Manual.


TASK 9/15 - Will you be using default gear depletion rates provided by the tool, or inputting your own gear specific values?


TASK 11a/15 - If sediment type is known, choose either mud, sand or gravel from the dropdown box next to the associated habitat type. If sediment is unknown, table modification is not required.


TASK 11b/15 - If you have a gear depletion value specific to the gear being assessed, enter it here. It must be a value between 0 and 1.


TASK 11c/15 - If you have a gear penetration depth (cm) specific to the gear being assessed, enter it here. It must be a positive value, in centimetres (cm).


Download the depletion rates used per habitat


Recovery Rates


On this tab you will set the recovery rates to be used in the assessment. Recovery rates are related to the longevity of an organism; species that live longer have a slower recovery rate (Hiddink et al., 2018). In the tool you have 3 options available for recovery rates, depending on what data and information you have available about the communities in your assessment area. Please read the User Manual for further information about the science behind these options, and for instructions about how to use each option.


TASK 13a/15: Enter longevity distribution parameters for each habitat type then click to generate the recovery rates

Enter the parameters for your species longevity distribution in the table below. You must provide evidence in your report to support the use of these values. For details of how to obtain these values, see the User Manual.


If you're interested in viewing the potential longevity and recovery distributions with modifications of m-slope and b, then have a play with the sliders below. IMPORTANT: Moving these sliders WILL NOT modify recovery rates used in the tool. You must input parameters into the table above to use a modelled longevity distribution or select another option for calculating recovery rates.


The species longevity distribution is converted to a distribution of recovery rates, see below.


TASK 13b/15: Upload a .csv file that contains species longevity data for each habitat type, to generate the recovery rates

Here you can input a .csv file of species longevity data, from unfished locations of each habitat type. It must be formatted as follows, with the bold terms used exactly as column headings (i.e. same capitalisation and spaces):

HabitatName - The habitat name, formatted in exactly the same way as in the habitat shapefile used

SpeciesName - The species name

SpeciesLongevity - The maximum lifespan (longevity) of the species, in years

ProportionOfBiomass - The proportion of total biomass that constitutes this species (value 0 - 1)


Once the data is processed, the plot output displays the proportion of species biomass within 4 longevity categories per habitat.


The table below shows the recovery rate per habitat. Displayed is the overall recovery rate, and the recovery rate within confidence intervals of SG60, SG80 and SG100. Please see the User Manual for further details about the confidence intervals or how the recovery rate is calculated.


TASK 13c/15: Click the button below to use the default recovery rates


The default value is 0.42 and this value is the lower confidence interval estimate of r from Hiddink et al (2017). (Further detail: r = 0.42 (median = 0.82, with 5-95% confidence intervals = 0.42 and 1.53))


Benthic Status


On this tab, the tool processes the data inputted on previous tabs to calculate the relative benthic status (RBS) for each grid cell. The RBS considers the ratio between depletion and recovery, in relation to the amount of fishing effort in each grid cell (see equation below, and the User Manual for more information about the RBS).


Below a map of overall RBS will appear for the area of assessment.

Download the RBS map (click button once and wait)

The table below shows the overall RBS score per habitat type.


Weighted overall RBS scores per habitat type:


Download the RBS summary table

The plot below illustrates the distribution of RBS scores for each grid cell of each habitat type.

Download the RBS histogram


Recovery time if fishing were to cease


Here the tool calculates the time it takes for the community biomass to recover. The recovery time will be used to generate an indicative MSC score for each habitat. This indicative score is calculated based on the quantitative data inputted into the Benthic Impacts Tool and is intended to aid scoring for Principle 2 of the MSC Fisheries Standard (see the User Manual for information on the scoring issue(s) that the indicative score should inform). For further guidance with this tab, please see the User Manual.


The plot below illustrates the recovery trajectory per habitat type (each habitat type shown in a separate panel). The grey lines illustrate the recovery trajectory for biomass in each individual grid cell. The black line indicates the mean recovery trajectory of all species biomass together across each habitat. The dashed line indicates an RBS of 0.8, or 80% carrying capacity. Each indicative MSC score relates to uncertainty in the recovery trajectory - to score SG100, there must be high certainty that the species biomass would recover to 80% within 20 years.

Please see the User Manual for more information on how the recovery trajectories relate to MSC scoring.


Download the Recovery Plot

The table below shows the time required for each habitat type to recover to an RBS score of 0.8, and the associated indicative MSC score.


Download the suggested MSC score table